Comparison
Question: I wonder how the bedtimes of 10XMA compare to the bedtimes of 9Hihi?
Hypothesis: I predict that the students in 10XMA will have a later bedtime than that of 9Hihi, as they are older and have more homework to complete. They may have more activities on, and generally have an overall busier life. They are also more mature, so therefore need less sleep, and are able to go to bed later.
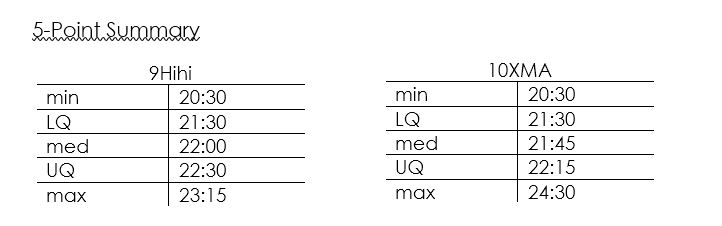
Plan/data: We have collected the data using the questions from the ‘Census at School’ website. Students entered their estimated bedtime to the nearest 15 min in 24 hour format. The data is measured in hours and minutes, and I will use this data to plan a 5-point summary. I will then use this information to construct a dot plot and a box and whisker plot to compare the statistics. I will manage sources of variation by ensuring that everyone knows that the time is in 24 hour format, and that they choose the right time. Students might also pretend they have a later bedtime than they actually do to seem cooler, and therefore be providing false data.
I have chosen to exclude the times 1:00, 1:15, and 3:30 from the data, as these are the more extreme values, and I believe that they would represent the average time unfairly. I have also decided to correct the time 12:30 to 24:30, as I presume they meant 12:30am (at night), but misread the question.
Analysis:
9Hihi
20:30, 21:00, 21:00, 21:00, 21:00, 21:30, 21:30, 21:30, 21:30, 21:45, 21:45, 22:00, 22:00, 22:00, 22:15, 22:15, 22:15, 22:30, 22:30, 22:30, 22:30, 22:45, 22:45, 23:15, 23:15.
10XMA
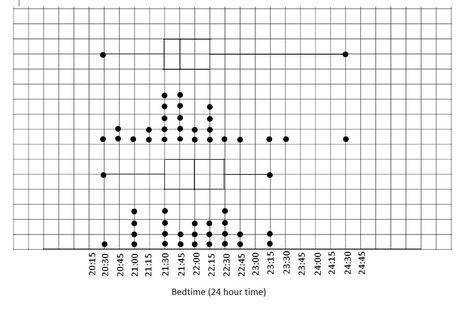
5-Point Summary - see top of this web page - graphs are there too - top boxplot is 10xma
20:30, 20:45, 20:45, 21:00, 21:15, 21:15, 21:30, 21:30, 21:30, 21:30, 21:30, 21:45, 21:45, 21:45, 21:45, 22:00, 22:00, 22:15, 22:15, 22:15, 22:15, 22:30, 22:45, 23:15, 23:15, 24:30.
Both of the dot plots are unimodel, however 10XMA’s is more skewed to the right. The main mound of data for 10XMA is between 20:30 and 22:45. There is an extreme value of 24:30. Possible reasons for this could be that they go to bed particularly late, or that the information was recorded wrong. The main mound of data for 9Hihi is between 20:30 and 23:15. Both the box plots have a quarter of the data between 20:30 and 21:30, however the year 9’s median and upper quartile are slightly later than the year 10’s. The middle 50% of the data for 10XMA is between 8:30 and 22:15, whereas for 9Hihi it is between 20:30 and 22:30. Both of the classes have very similar bedtimes, despite a few of the more extreme values in the year 10 class.
Conclusion: I conclude that there is not enough evidence to support that the students in 10XMA have a later bedtime than the students in 9Hihi. This is because the median for 10XMA is not outside the range of the box for 9Hihi, and the data therefore does not support my hypothesis. From the information I have gathered, the year 10’s seem to have a very similar bedtime to that of the year 9’s, however there were a few more extreme values at later times for the year 10’s. This is evident because most of the data for the year 9’s and 10’s is between 20:30 – 23:15, with the exception of the extreme values of 23:30 and 24:30 in10XMA. I do not think my results would be very good to make any predictions about the wider population, and would need a bigger sample to make any predictions.
Question: I wonder how the bedtimes of 10XMA compare to the bedtimes of 9Hihi?
Hypothesis: I predict that the students in 10XMA will have a later bedtime than that of 9Hihi, as they are older and have more homework to complete. They may have more activities on, and generally have an overall busier life. They are also more mature, so therefore need less sleep, and are able to go to bed later.
Plan/data: We have collected the data using the questions from the ‘Census at School’ website. Students entered their estimated bedtime to the nearest 15 min in 24 hour format. The data is measured in hours and minutes, and I will use this data to plan a 5-point summary. I will then use this information to construct a dot plot and a box and whisker plot to compare the statistics. I will manage sources of variation by ensuring that everyone knows that the time is in 24 hour format, and that they choose the right time. Students might also pretend they have a later bedtime than they actually do to seem cooler, and therefore be providing false data.
I have chosen to exclude the times 1:00, 1:15, and 3:30 from the data, as these are the more extreme values, and I believe that they would represent the average time unfairly. I have also decided to correct the time 12:30 to 24:30, as I presume they meant 12:30am (at night), but misread the question.
Analysis:
9Hihi
20:30, 21:00, 21:00, 21:00, 21:00, 21:30, 21:30, 21:30, 21:30, 21:45, 21:45, 22:00, 22:00, 22:00, 22:15, 22:15, 22:15, 22:30, 22:30, 22:30, 22:30, 22:45, 22:45, 23:15, 23:15.
10XMA
5-Point Summary - see top of this web page - graphs are there too - top boxplot is 10xma
20:30, 20:45, 20:45, 21:00, 21:15, 21:15, 21:30, 21:30, 21:30, 21:30, 21:30, 21:45, 21:45, 21:45, 21:45, 22:00, 22:00, 22:15, 22:15, 22:15, 22:15, 22:30, 22:45, 23:15, 23:15, 24:30.
Both of the dot plots are unimodel, however 10XMA’s is more skewed to the right. The main mound of data for 10XMA is between 20:30 and 22:45. There is an extreme value of 24:30. Possible reasons for this could be that they go to bed particularly late, or that the information was recorded wrong. The main mound of data for 9Hihi is between 20:30 and 23:15. Both the box plots have a quarter of the data between 20:30 and 21:30, however the year 9’s median and upper quartile are slightly later than the year 10’s. The middle 50% of the data for 10XMA is between 8:30 and 22:15, whereas for 9Hihi it is between 20:30 and 22:30. Both of the classes have very similar bedtimes, despite a few of the more extreme values in the year 10 class.
Conclusion: I conclude that there is not enough evidence to support that the students in 10XMA have a later bedtime than the students in 9Hihi. This is because the median for 10XMA is not outside the range of the box for 9Hihi, and the data therefore does not support my hypothesis. From the information I have gathered, the year 10’s seem to have a very similar bedtime to that of the year 9’s, however there were a few more extreme values at later times for the year 10’s. This is evident because most of the data for the year 9’s and 10’s is between 20:30 – 23:15, with the exception of the extreme values of 23:30 and 24:30 in10XMA. I do not think my results would be very good to make any predictions about the wider population, and would need a bigger sample to make any predictions.
