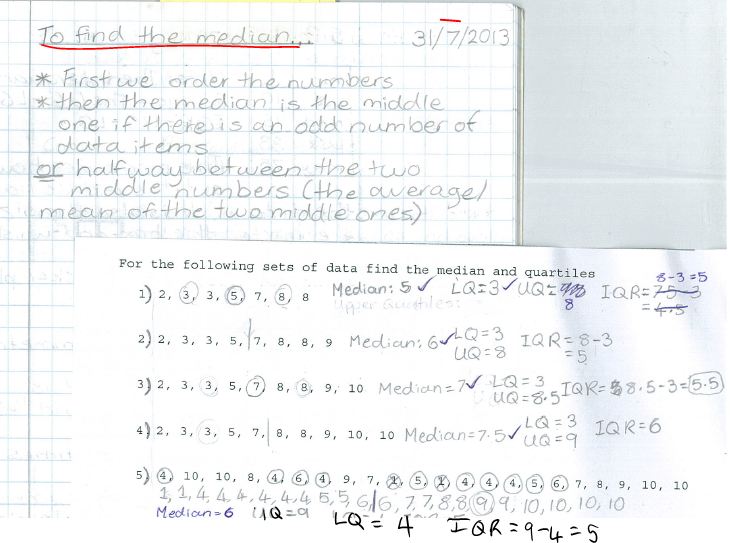
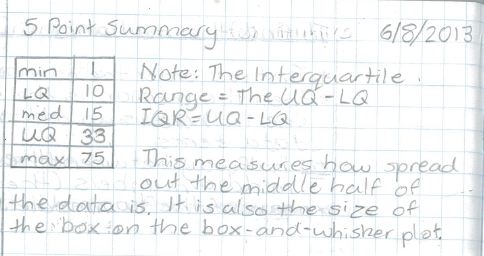
The lower quartile (LQ) is the median of the lower half of data values. The upper quartile (UQ) is the median of the top half of data values. The Range = the highest value in the data set - (minus) the lowest value. The interquartile range (IQR) = the UQ - the LQ The 5-point summary is a table of the values we need in order to draw a box and whisker plot.