statistical experiments
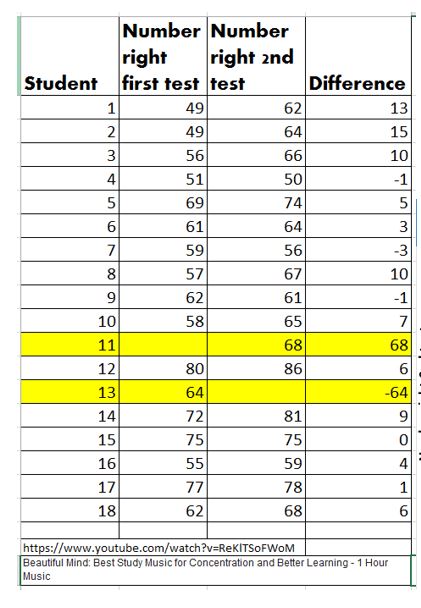
Our class experiment - to see if we remember more with or without "music for relaxing and concentration" - here are our results - or you can download the excel file from further below.
|
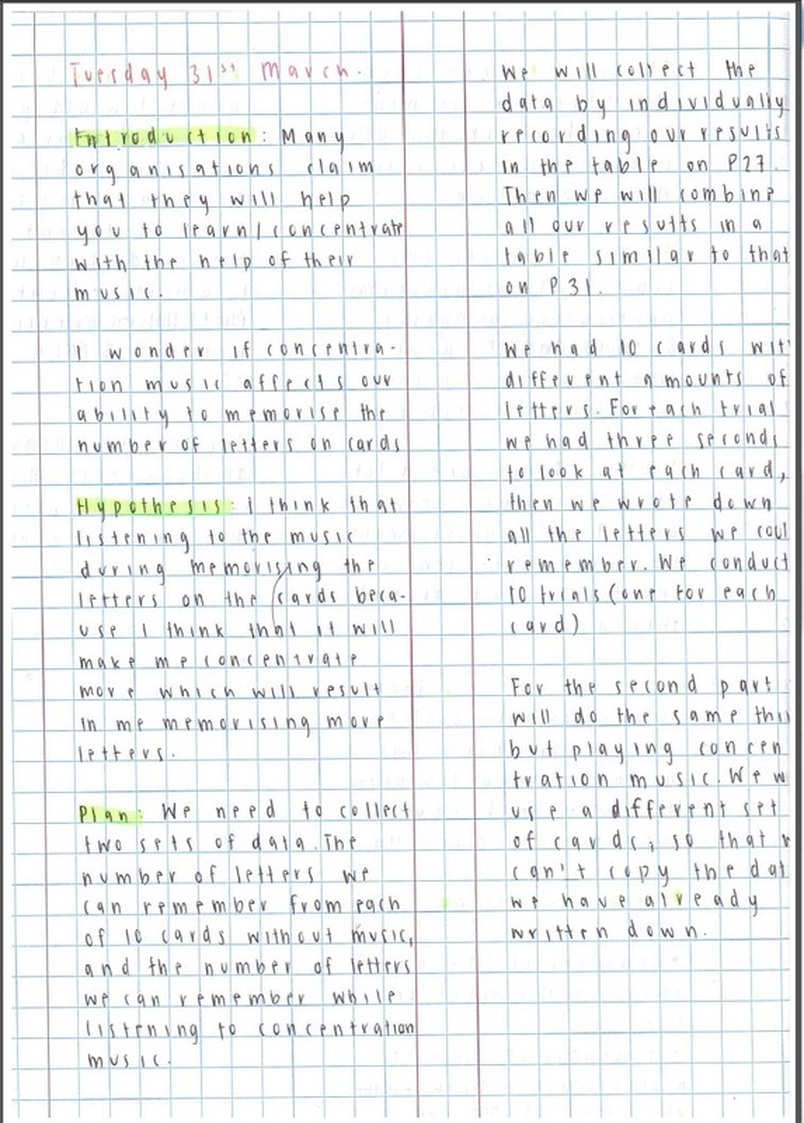
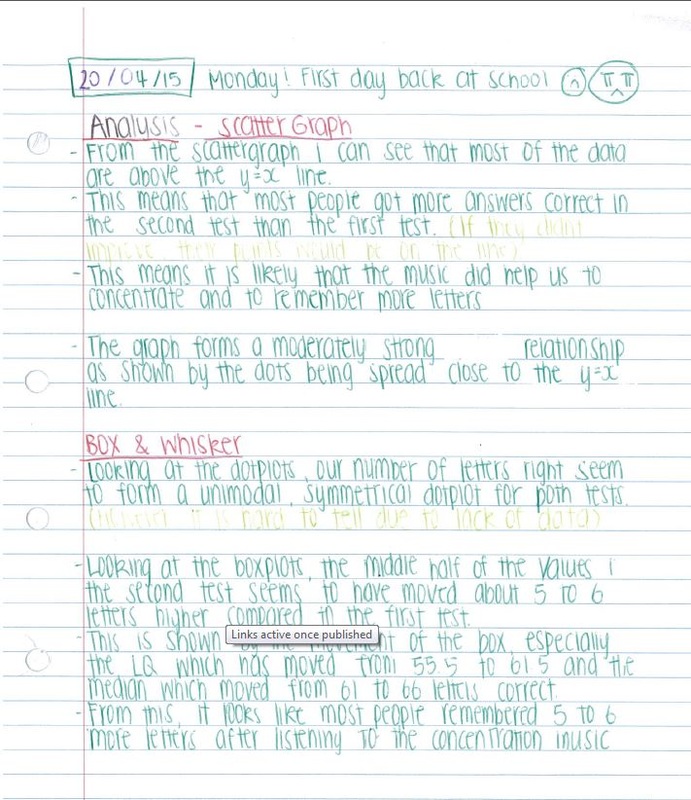
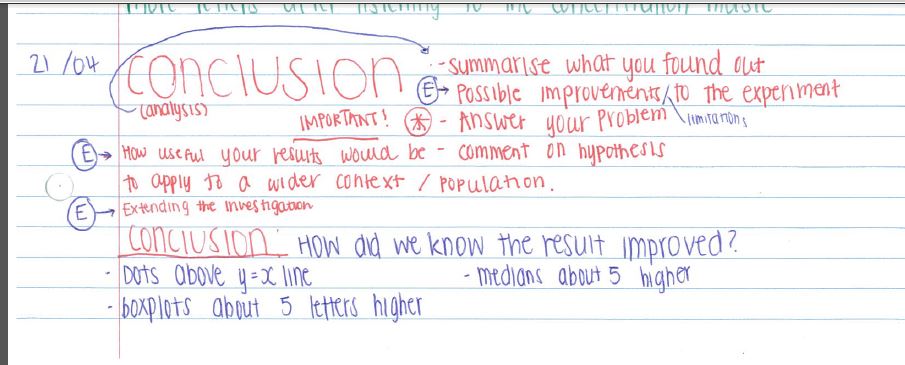
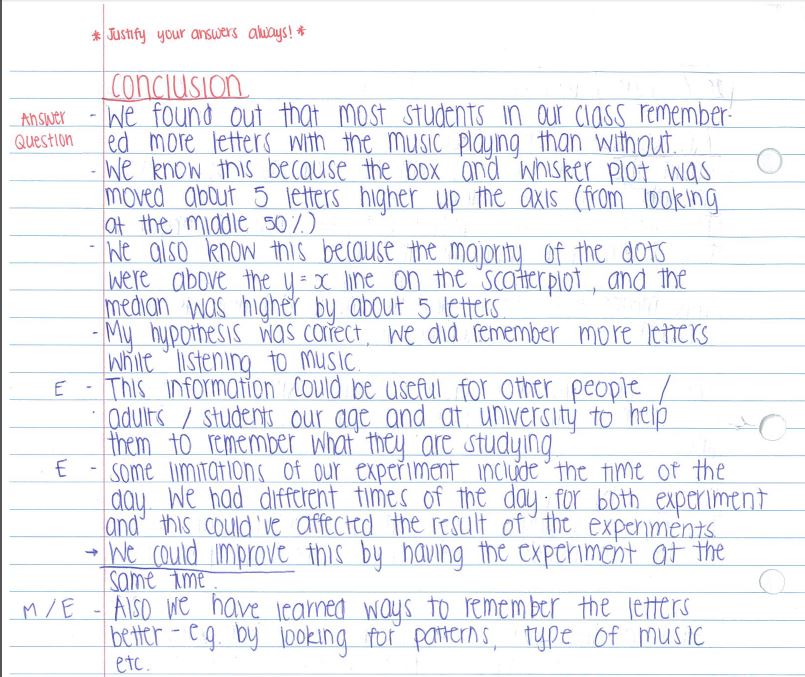
And here is the problem and plan which we wrote. (it was period 5 on a hot afternoon.)
|
| ||
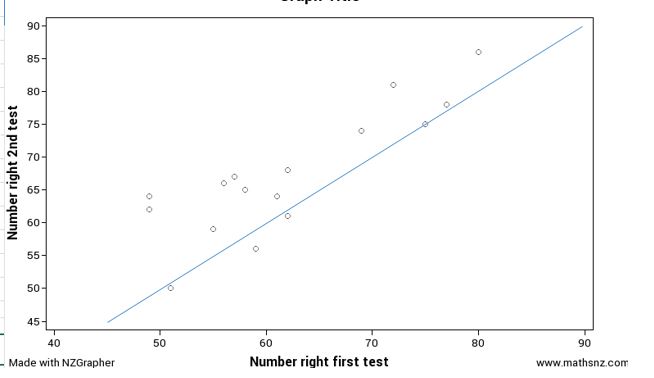
blue line above is y=x line
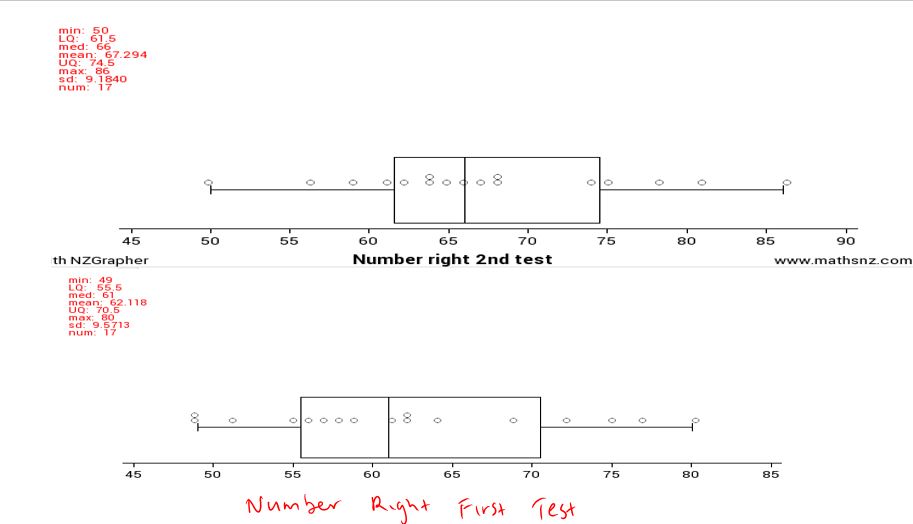
Title below: Dot and Box plots of our results for remembering the number of letters written on a card with and without listening to music.
Title below: Dot and Box plots of our results for remembering the number of letters written on a card with and without listening to music.
| grace_12mat02.pdf |
The music we chose was from:
https://www.youtube.com/watch?v=ReKlTSoFWoM
and had the title:
Beautiful Mind: Best Study Music for Concentration and Better Learning - 1 Hour Music
https://www.youtube.com/watch?v=ReKlTSoFWoM
and had the title:
Beautiful Mind: Best Study Music for Concentration and Better Learning - 1 Hour Music
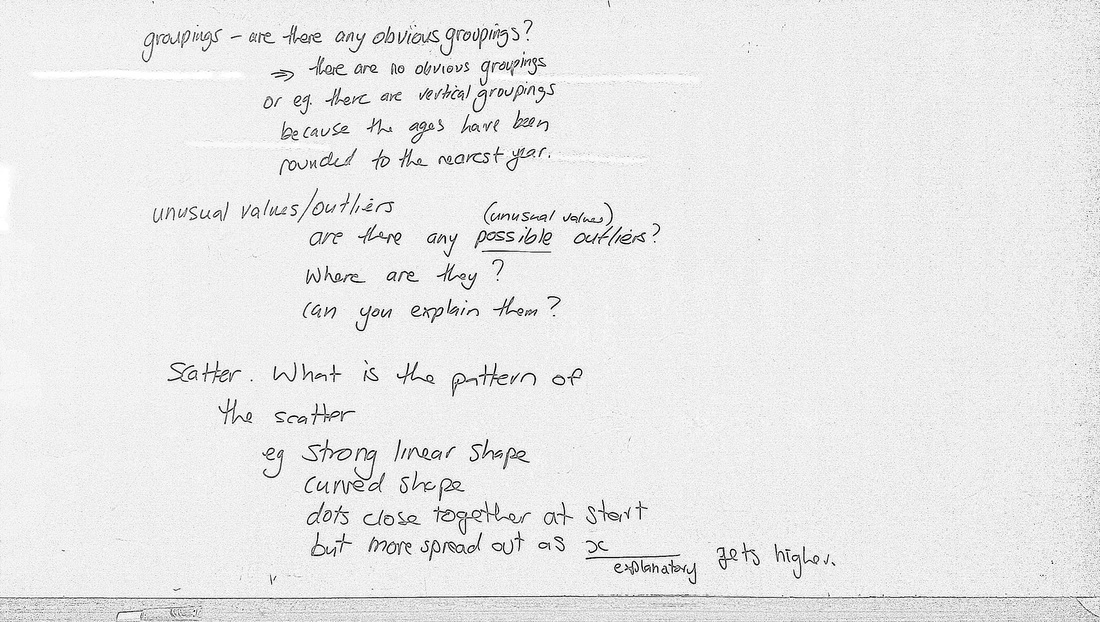
Describing Scatterplots
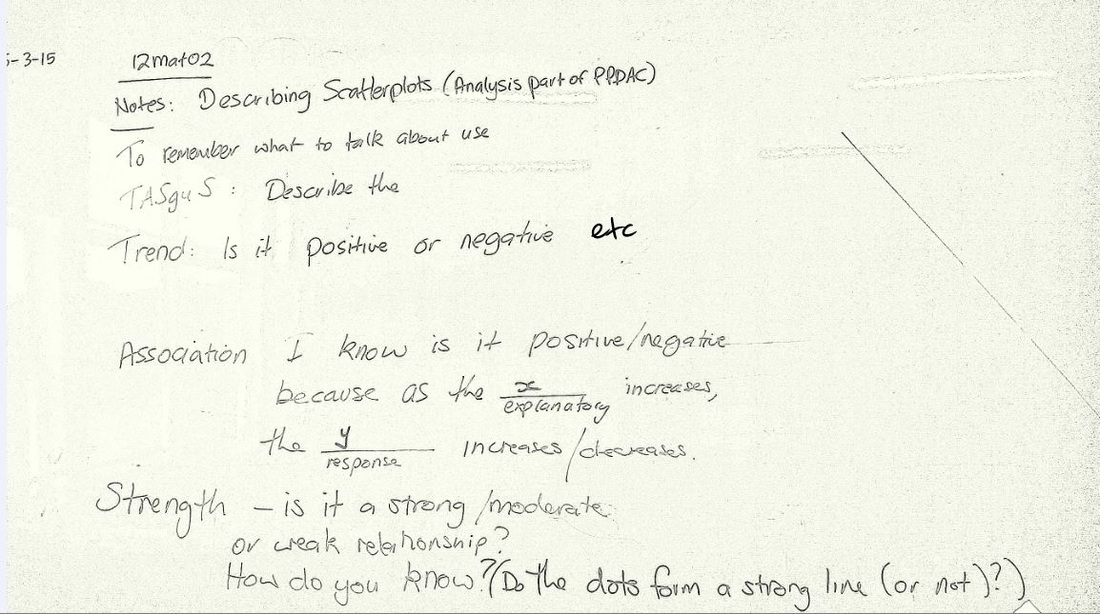
You could also use your scatter plot to make predictions for the response variable by choosing a value for your explanatory variable.
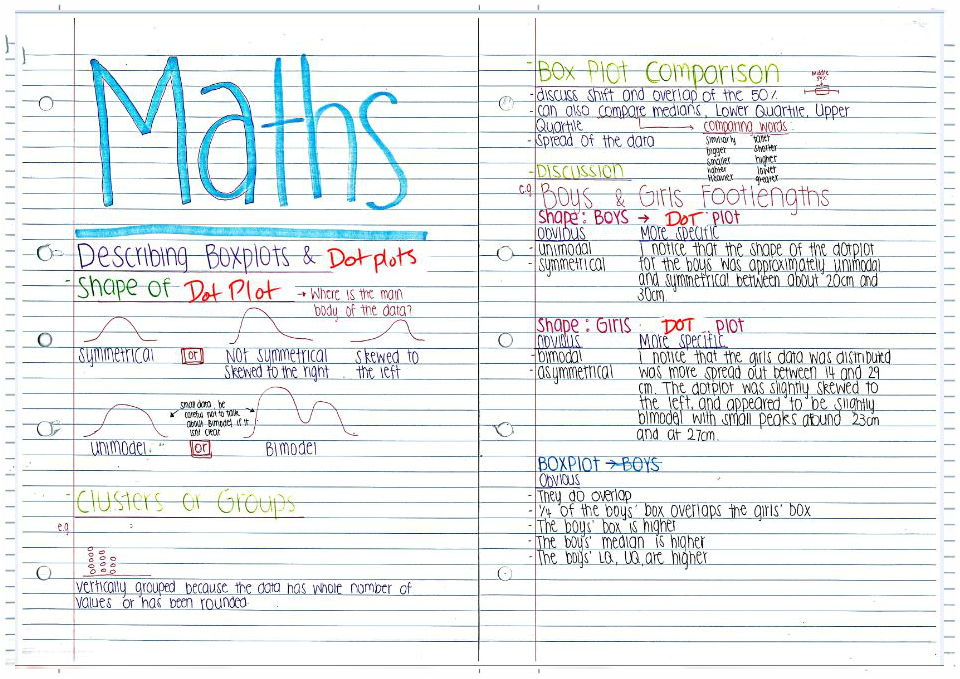
Describing Dotplots and Boxplots
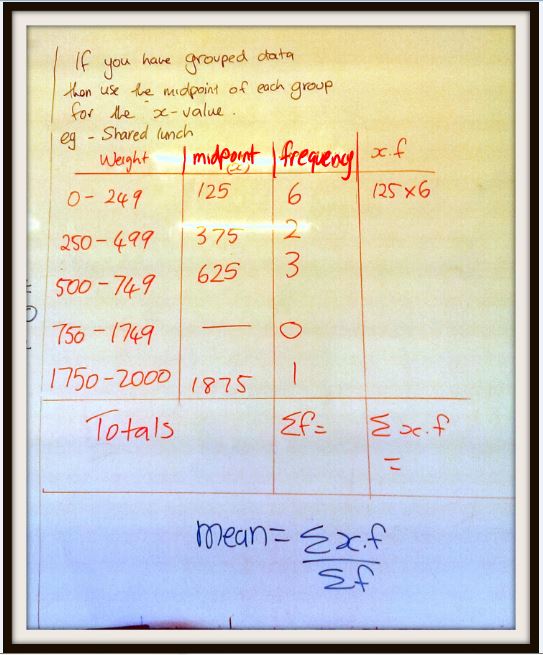
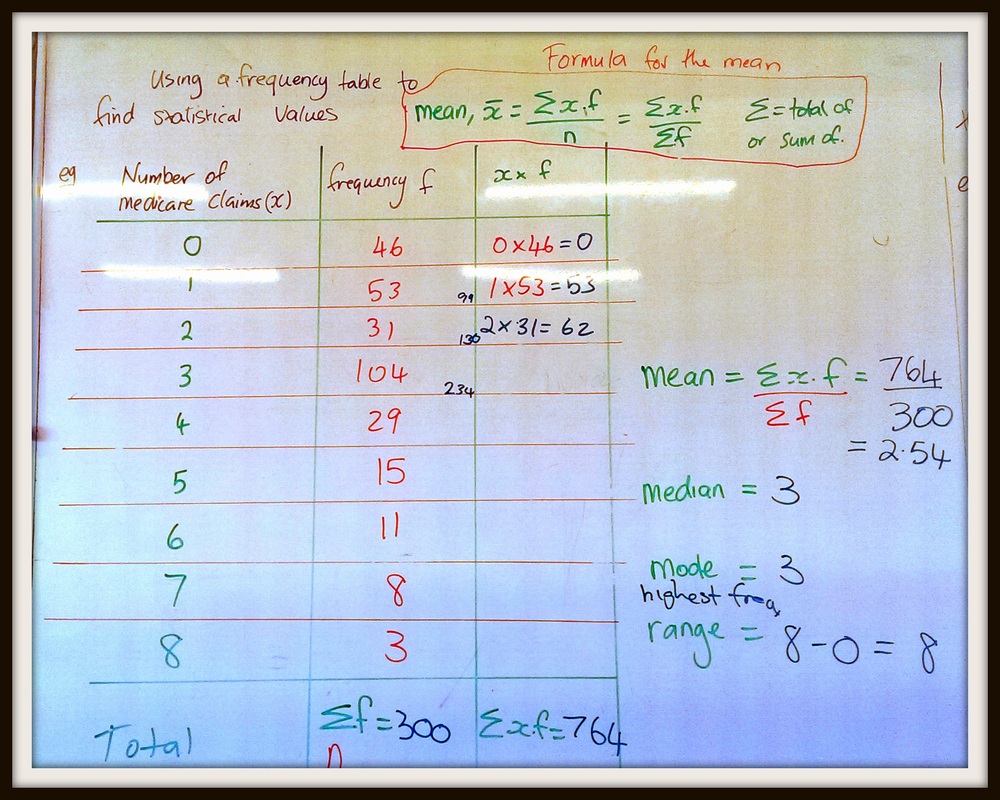
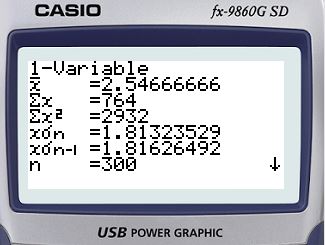
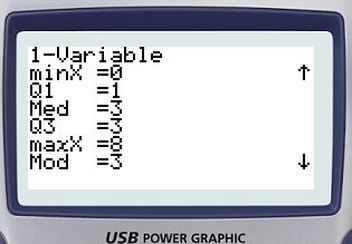
Class example on finding the mean, using a frequency table. To use a graphics calculator, use calc--> set to tell it to put the frequencies in list 2
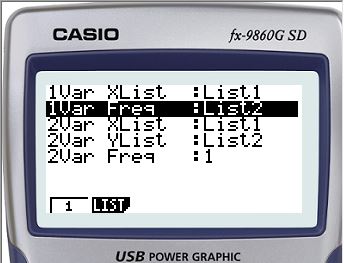
Then you can enter the first column in list 1 and the frequencies in list 2
|
|
If you have grouped data, you can do almost the same thing, but you will have to find the midpoints of your groups to be your x-values or list1 values.