12Mat02: Welcome to our class 2015.
|
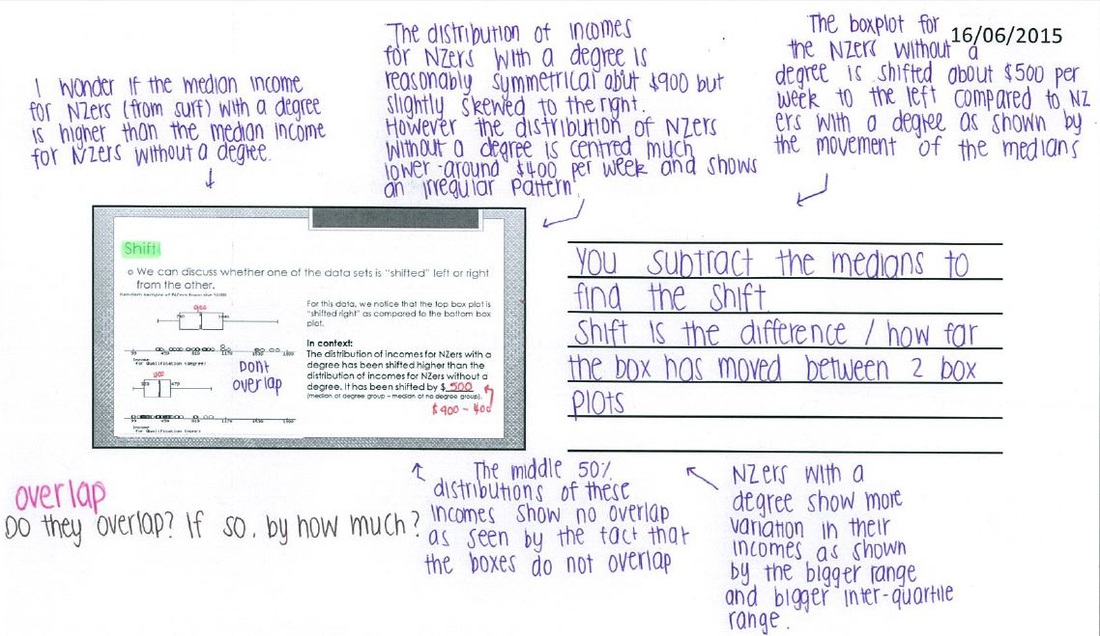
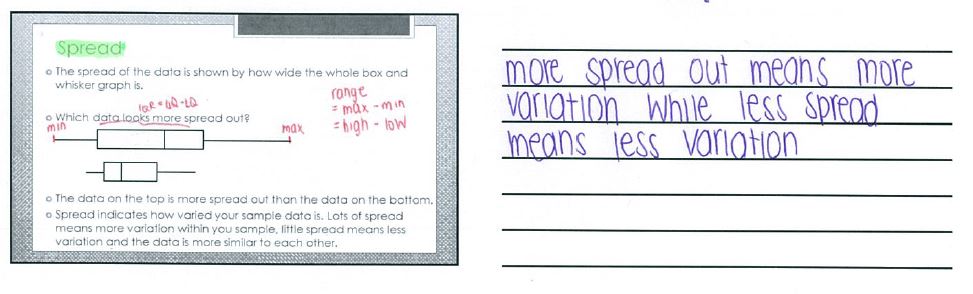
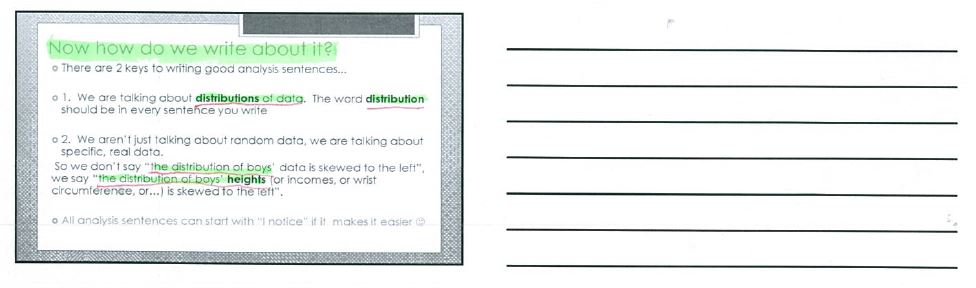
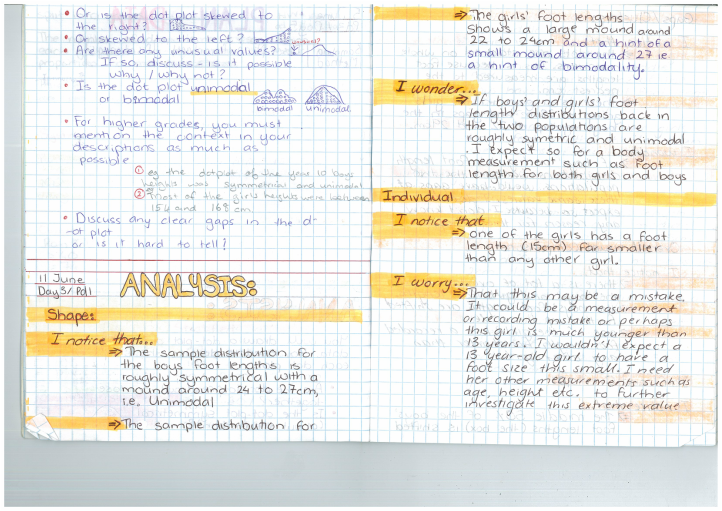
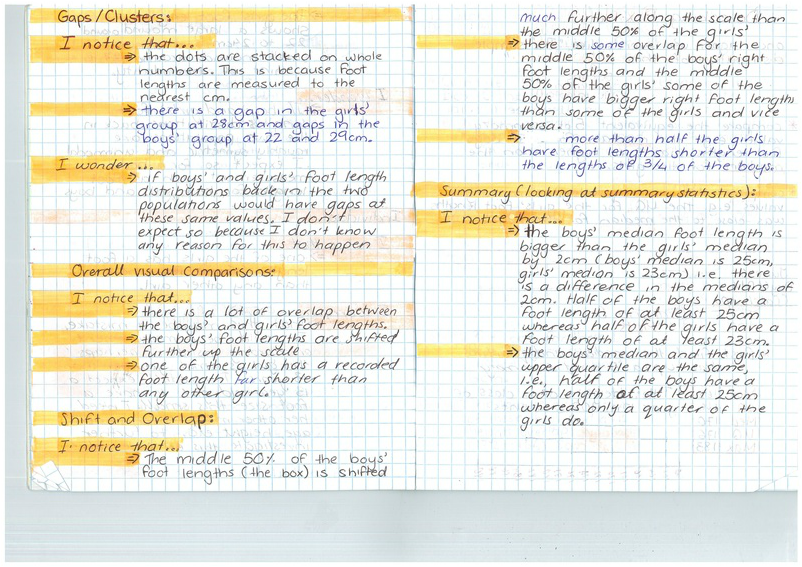
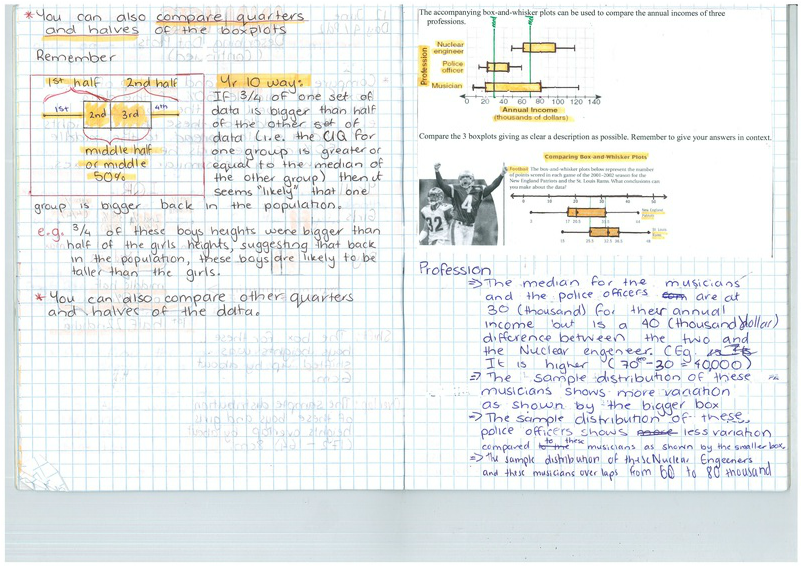
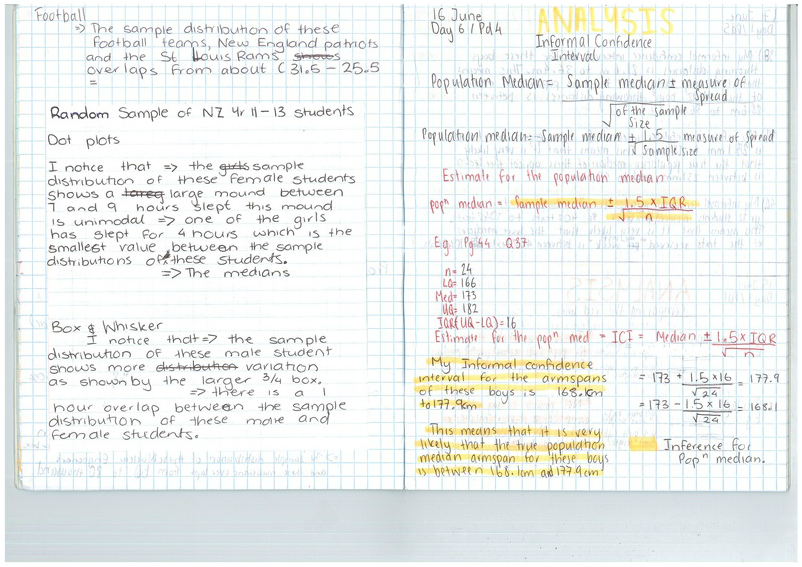
Examples of describing the graphs discussing Shape, Centre or shift, Spread and and unusual features (if any) . [Thank you , Jina]
|
24 June 2014 -= powerpoint of our rough report together on males vs females weekly income from the surf database. Also a scan of Jolene's NEAT and tidy version in her own words. (Thankyou Jolene!)
Also, below that is Jolene's practice report which she submitted for marking and would like to share in case you are stuck.
Also, below that is Jolene's practice report which she submitted for marking and would like to share in case you are stuck.
| inference_example_to_do_together4.pps |
| lesson_5_-_using_mathstatic_to_produce_graphs.pptx |
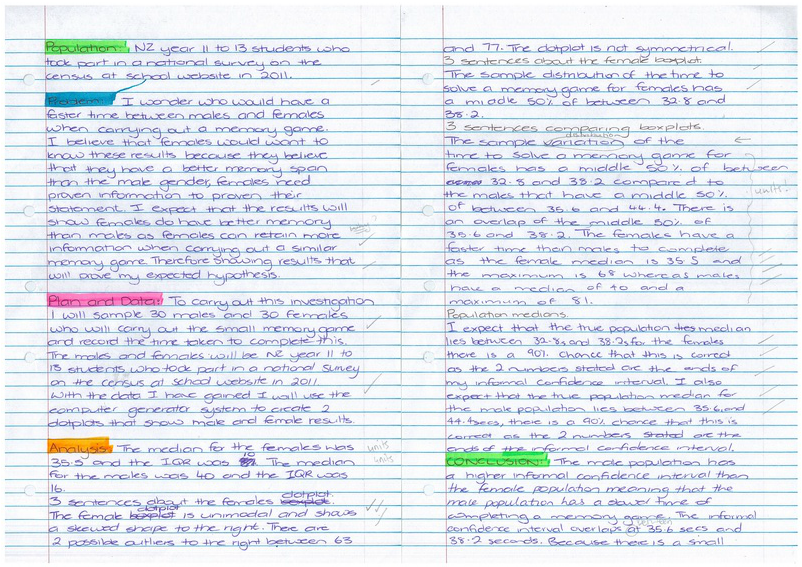
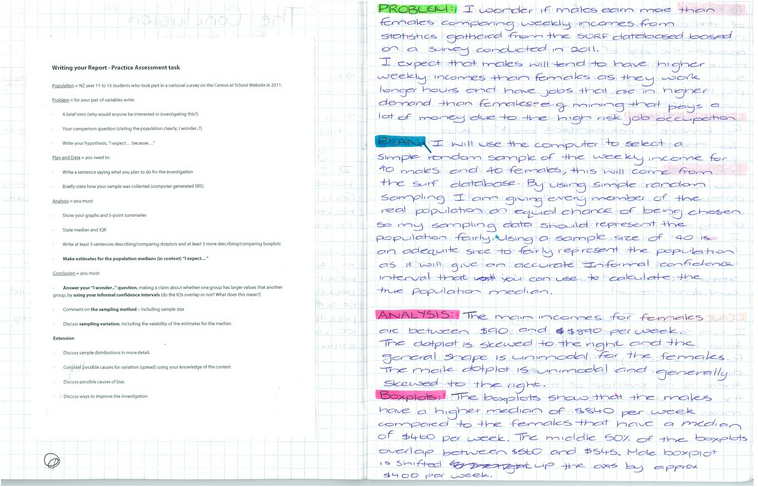
Writing your Report - Practice Assessment task
Population = NZ year 11 to 13 students who took part in a national survey on the census at school website in 2011.
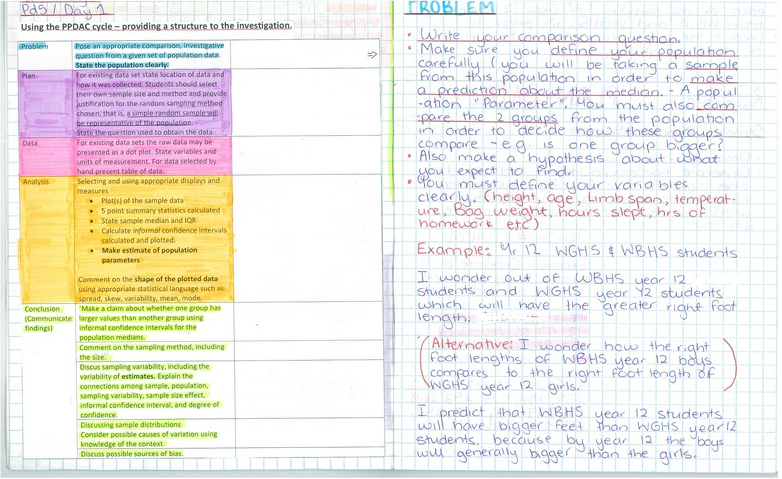
Problem = for your pair of variables write:
· A brief intro (why would anyone be interested in investigating this?)
· Your comparison question (stating the population clearly, I wonder..?)
· Write your hypothesis, “I expect… because…”
Plan and Data = you need to:
· Write a sentence saying what you plan to do for the investigation
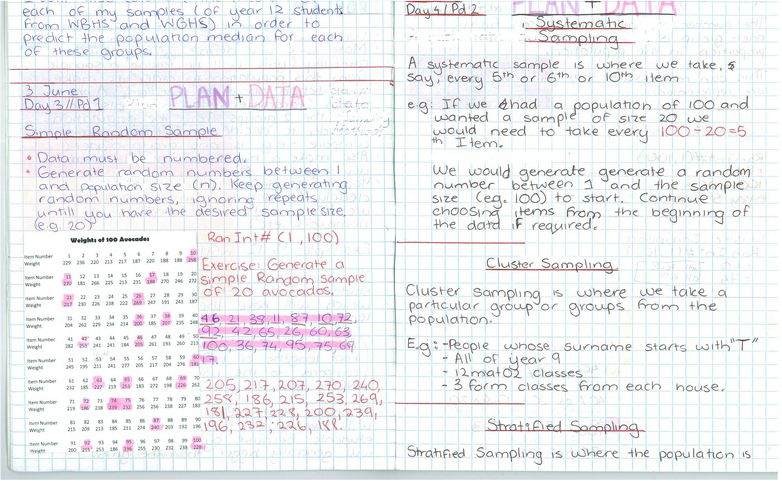
· Briefly state how your sample was collected (computer generated SRS)
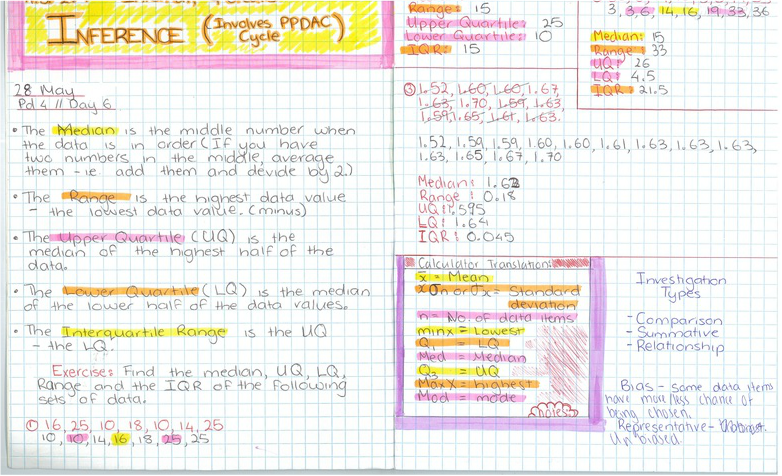
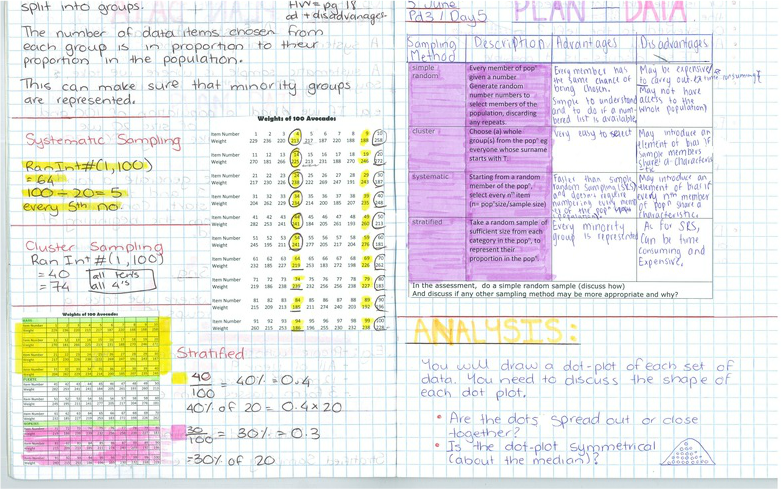
Analysis = you must:
· Show your graphs and 5-point summaries
· State median and IQR
· Write at least 3 sentences describing/comparing dotplots and at least 3 more describing/comparing boxplots
· Make estimates for the population medians (in context) “I expect…”
Conclusion = you must:
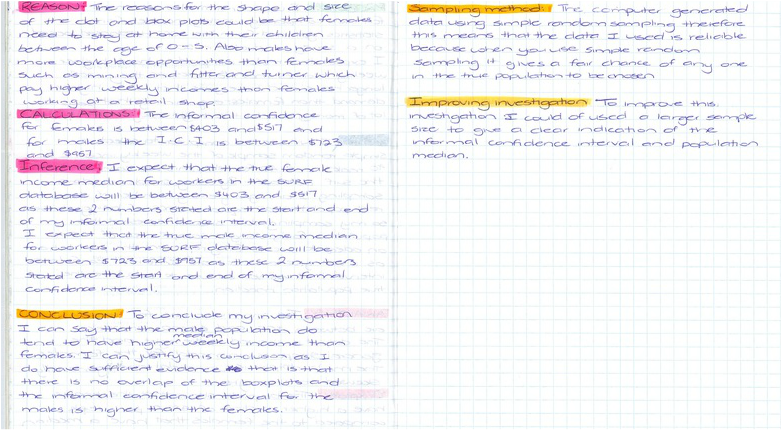
· Answer your “I wonder..” question, making a claim about whether one group has larger values that another group, by using your informal confidence intervals (do the ICIs overlap or not? What does this mean?)
· Comment on the sampling method – including sample size
· Discuss sampling variation, including the vaiability of the estimates for the median.
Extension
· Discuss sample distributions in more detail.
· Consider possible causes for variation (spread) using your knowledge of the contest
· Discuss possible causes of bias
· Discuss ways to improve the investigation
Population = NZ year 11 to 13 students who took part in a national survey on the census at school website in 2011.
Problem = for your pair of variables write:
· A brief intro (why would anyone be interested in investigating this?)
· Your comparison question (stating the population clearly, I wonder..?)
· Write your hypothesis, “I expect… because…”
Plan and Data = you need to:
· Write a sentence saying what you plan to do for the investigation
· Briefly state how your sample was collected (computer generated SRS)
Analysis = you must:
· Show your graphs and 5-point summaries
· State median and IQR
· Write at least 3 sentences describing/comparing dotplots and at least 3 more describing/comparing boxplots
· Make estimates for the population medians (in context) “I expect…”
Conclusion = you must:
· Answer your “I wonder..” question, making a claim about whether one group has larger values that another group, by using your informal confidence intervals (do the ICIs overlap or not? What does this mean?)
· Comment on the sampling method – including sample size
· Discuss sampling variation, including the vaiability of the estimates for the median.
Extension
· Discuss sample distributions in more detail.
· Consider possible causes for variation (spread) using your knowledge of the contest
· Discuss possible causes of bias
· Discuss ways to improve the investigation
Writing the conclusion
“The Conclusion.”
Comparing red lines
“Making a claim”
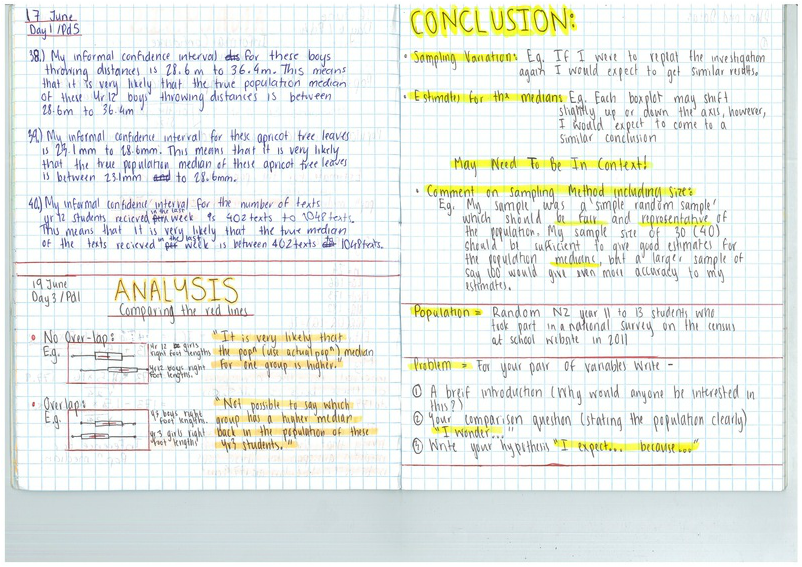
· No overlap = it is very likely that “the population” median for one group is higher.
· Overlap = not possible to say which group has a higher median back in the population of these year 12 students.
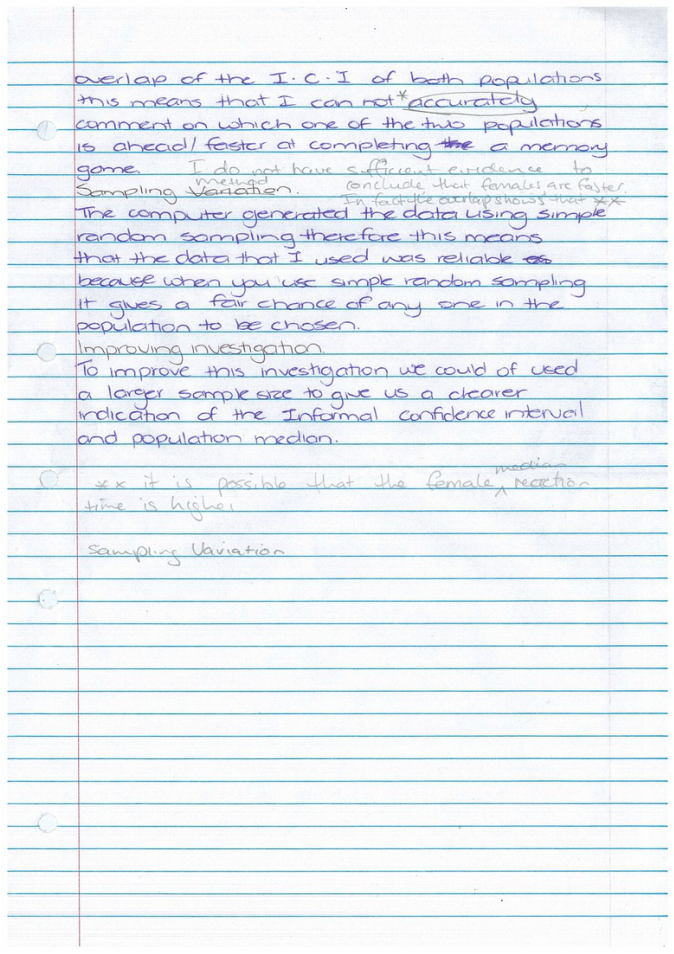
Sampling Variation
If I were to repeat the experiment again I would expect to get similar estimates for the medians. Each boxplot may shift slightly up or down the axis, however, I would expect to come to a similar conclusion. Will NEED TO BE IN CONTEXT!
Comment on sampling method including. Size. My sample was a simple random sample should be fair and representative of the population. My sample size of 30 (40) should be sufficient to give good estimates for the population medians, but a larger sample say 100 would give even more accuracy.
“The Conclusion.”
Comparing red lines
“Making a claim”
· No overlap = it is very likely that “the population” median for one group is higher.
· Overlap = not possible to say which group has a higher median back in the population of these year 12 students.
Sampling Variation
If I were to repeat the experiment again I would expect to get similar estimates for the medians. Each boxplot may shift slightly up or down the axis, however, I would expect to come to a similar conclusion. Will NEED TO BE IN CONTEXT!
Comment on sampling method including. Size. My sample was a simple random sample should be fair and representative of the population. My sample size of 30 (40) should be sufficient to give good estimates for the population medians, but a larger sample say 100 would give even more accuracy.
BELOW ARE SCANS OF SAM'S NOTES BOOK, WHICH SHE HAS KINDLY SHARED IN CASE ANYONE HAS MISSED A CLASS. AFTER THAT IS THE DOCUMENT WITH EXAMPLES OF DESCRIPTIONS BASED ON FOOTSIZE.

Also talk about what effect it would have if you increase the sample size significantly.
Below are links to NZQA exemplars which may help you with your practice reports.
http://www.nzqa.govt.nz/qualifications-standards/qualifications/ncea/subjects/mathematics/exemplars/level-2-as91264-a/
http://www.nzqa.govt.nz/qualifications-standards/qualifications/ncea/subjects/mathematics/exemplars/level-2-as91264-b/
| descriptions_and_inferences_example.pdf |
