AS3.9 (91581) Carry out investigations of phenomena, using the statistical enquiry cycle.
Links to NZQA exemplars on this topic - i would recommend reading through these and identifying what the students are doing. Also the examiner's comments about how to improve.
http://www.nzqa.govt.nz/qualifications-standards/qualifications/ncea/subjects/mathematics/exemplars/level-3-as91581-a/
http://www.nzqa.govt.nz/qualifications-standards/qualifications/ncea/subjects/mathematics/exemplars/level-3-as91581-b/
Summary from Taylor, Thursday
To complete an Excellence level report, you must do:
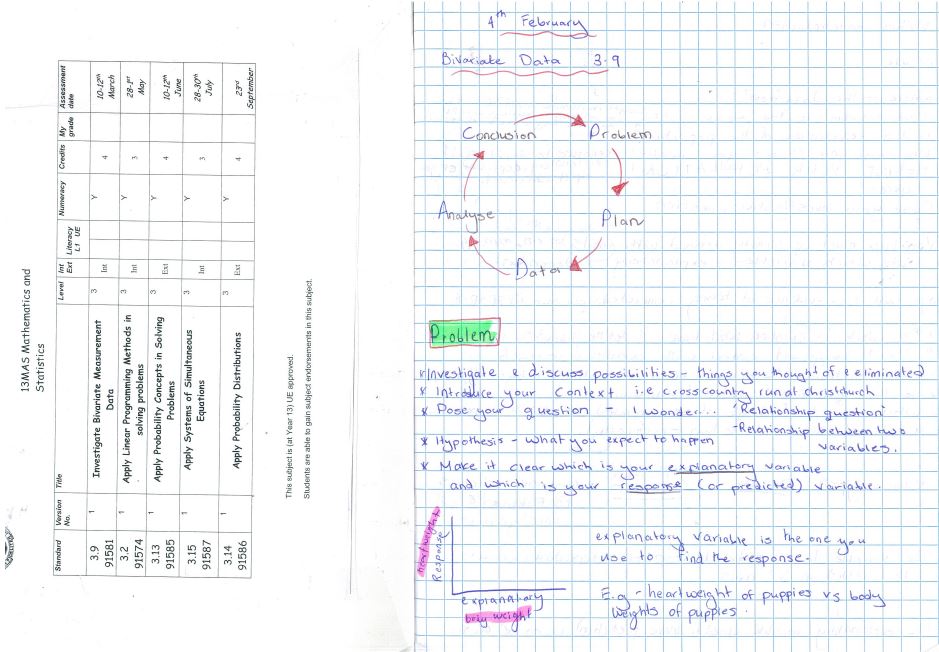
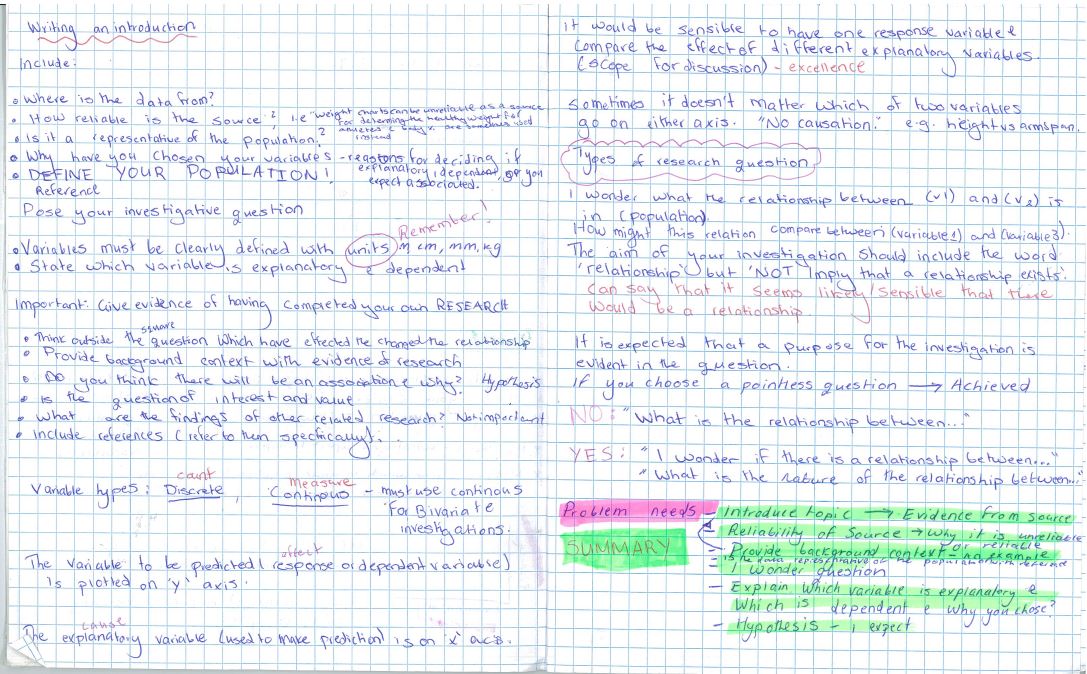
Intro/purpose/hypothesis
Plan
Data/graphs
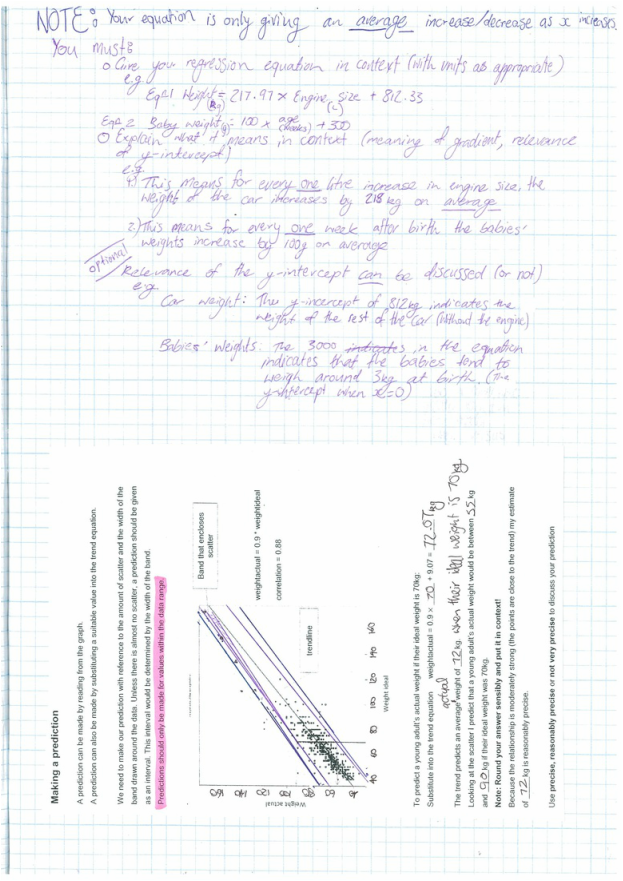
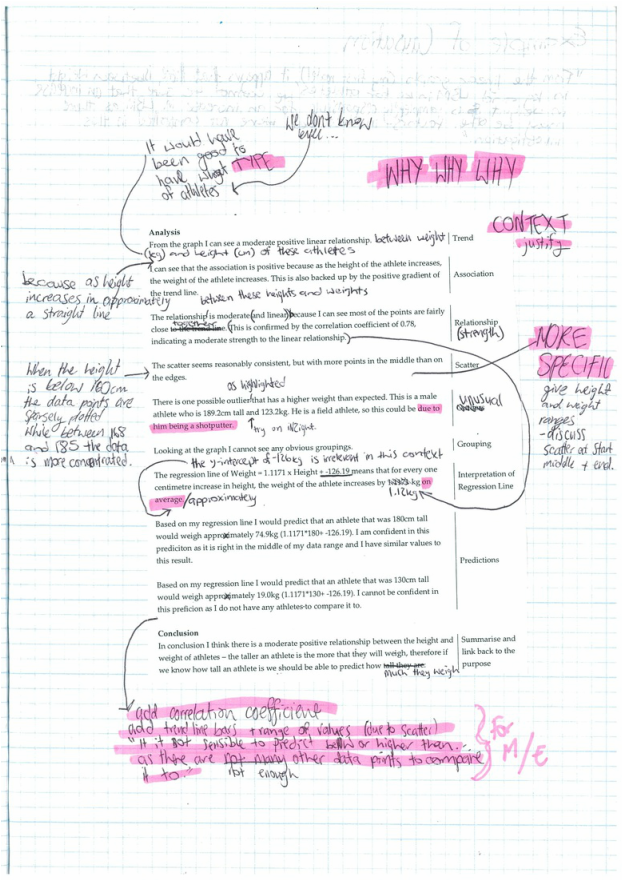
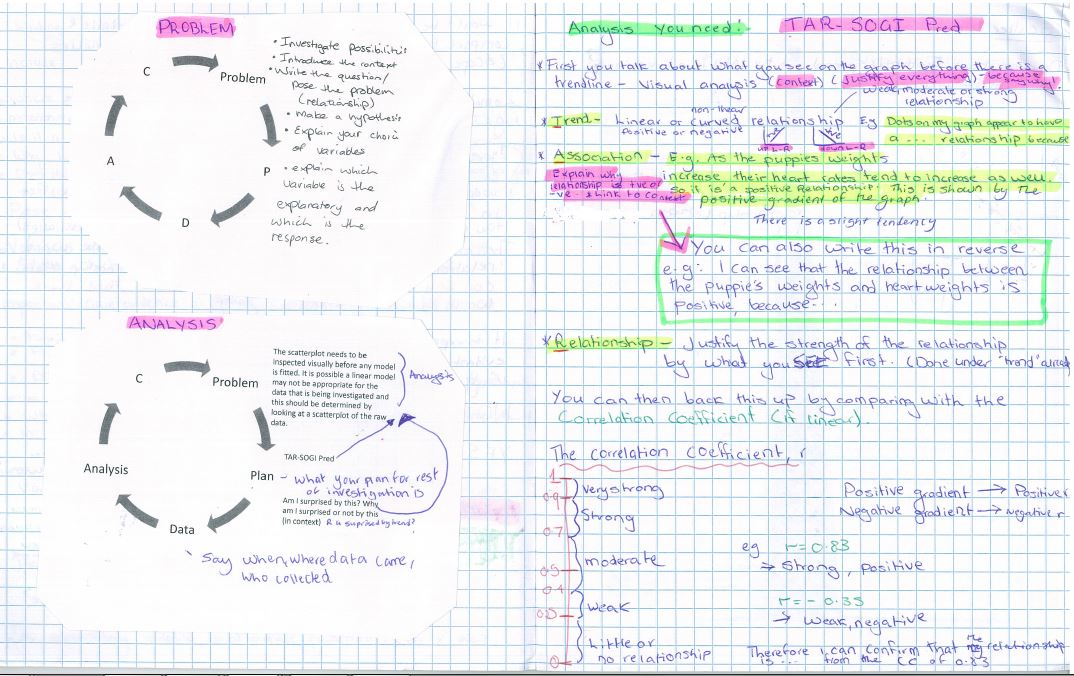
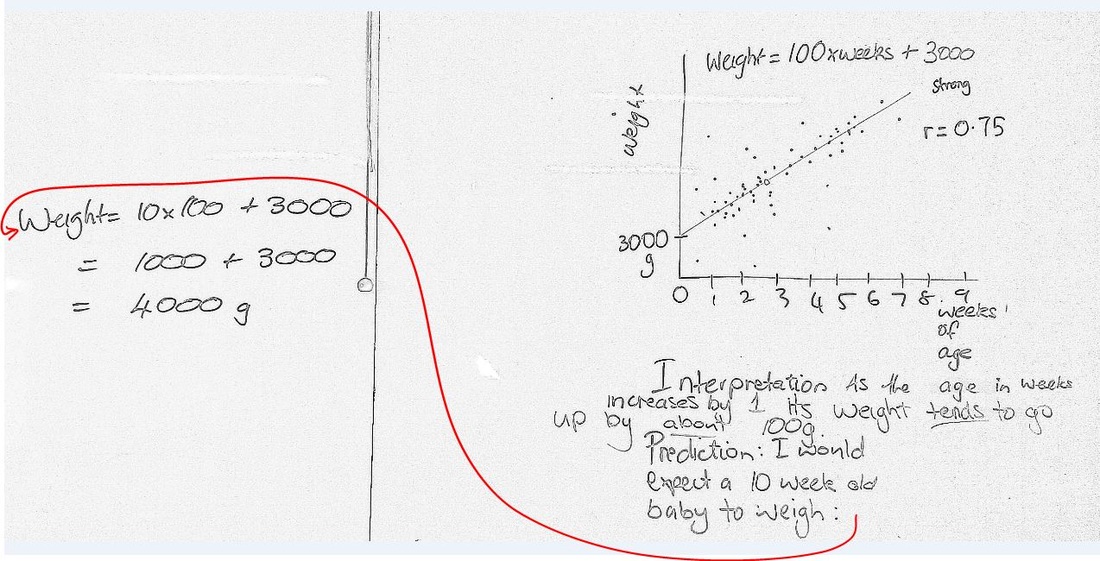
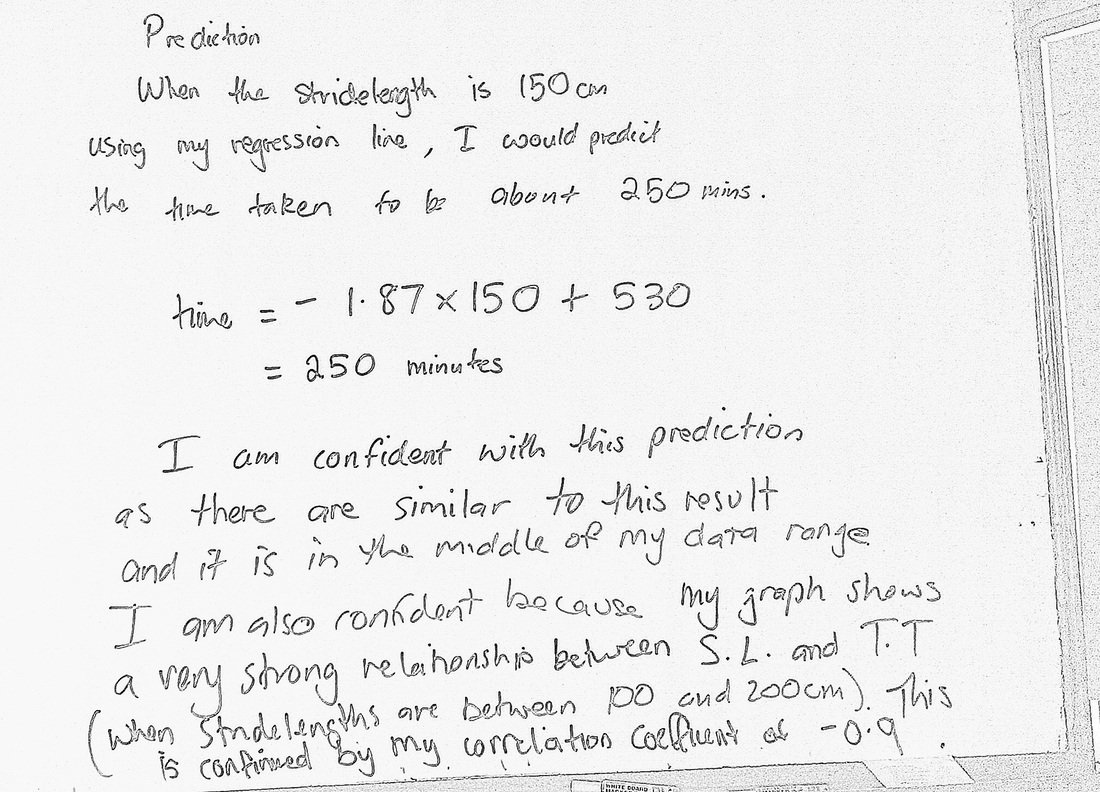
Analyse -> TARSOG-I-Pred
Conclusion - A-R-S-E
For EXCELLENCE, THE STANDARD SAYS you need to:
“INVESTIGATE BIVARIATE MEASUREMENT DATA WITH STATISTICAL INSIGHT
-this involves integrating statistical and contextual knowledge throughout the investigation process, and may include reflecting about the process; considering other relevant variables; evaluating the adequacy of any models, or showing a deeper understanding of the models.”
Below are Moana's notes for 2014, and far below are last year's notes.
Also see your workbook and check out
http://maths.nayland.school.nz/Year_13_Maths/3.9_Bivariate_data/Bivariate_Home.htm.
http://www.nzqa.govt.nz/qualifications-standards/qualifications/ncea/subjects/mathematics/exemplars/level-3-as91581-a/
http://www.nzqa.govt.nz/qualifications-standards/qualifications/ncea/subjects/mathematics/exemplars/level-3-as91581-b/
Summary from Taylor, Thursday
To complete an Excellence level report, you must do:
Intro/purpose/hypothesis
Plan
Data/graphs
Analyse -> TARSOG-I-Pred
- For Exc - Extend - -> EITHER - curve OR subgroups OR different response variable - do a QUICK summary of the new TAR and compare to something AND do a QUICK prediction comparisation - say which model would be most useful/accurate for predicting/why.
- Reflected on predictions by discussing their relevance to a wider population.
- Justified choice of model somewhere – eg, using residuals.
Conclusion - A-R-S-E
- Answer the Research Question
- Research – Relate your findings to some research you have done
- Summarise your findings
- Evaluate the process eg. limitations/bias/assumptions/improvements
For EXCELLENCE, THE STANDARD SAYS you need to:
“INVESTIGATE BIVARIATE MEASUREMENT DATA WITH STATISTICAL INSIGHT
-this involves integrating statistical and contextual knowledge throughout the investigation process, and may include reflecting about the process; considering other relevant variables; evaluating the adequacy of any models, or showing a deeper understanding of the models.”
Below are Moana's notes for 2014, and far below are last year's notes.
Also see your workbook and check out
http://maths.nayland.school.nz/Year_13_Maths/3.9_Bivariate_data/Bivariate_Home.htm.
| bivariate_data_-_intro.pptx |
| defining_the_problem.pptx |
now that we are getting closer to the assessment date it is time to look at the exemplars for more ideas on how to reach the highest level you can.
you can download the NZQA exemplars from:
http://www.nzqa.govt.nz/qualifications-standards/qualifications/ncea/subjects/mathematics/exemplars/
you can download the NZQA exemplars from:
http://www.nzqa.govt.nz/qualifications-standards/qualifications/ncea/subjects/mathematics/exemplars/
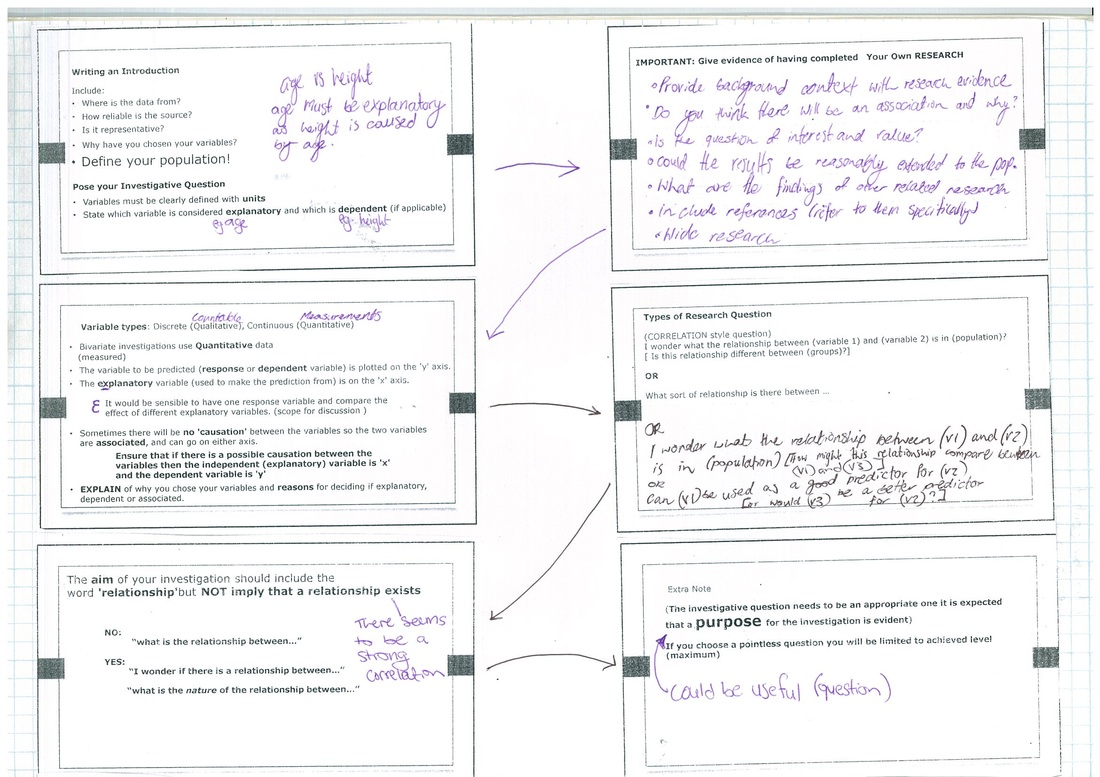
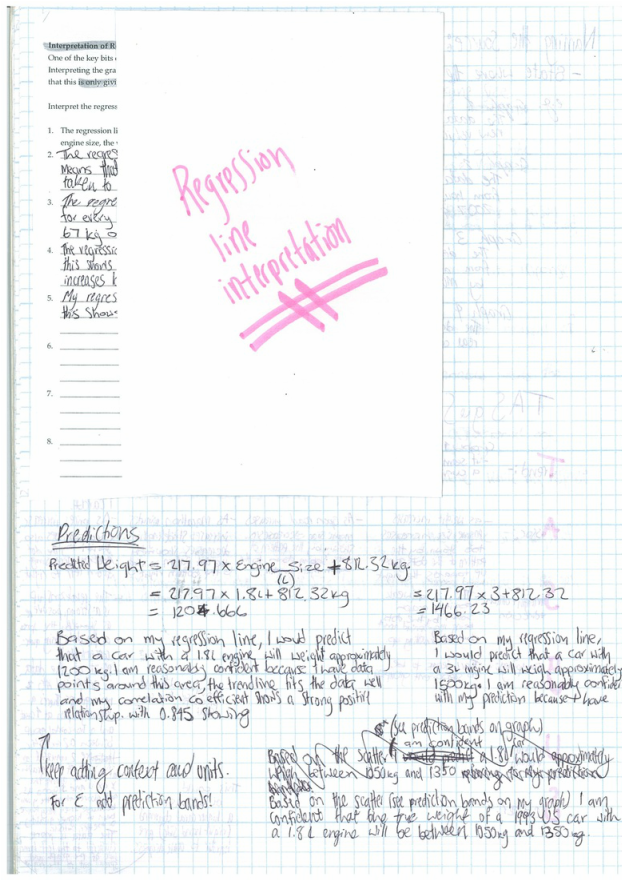
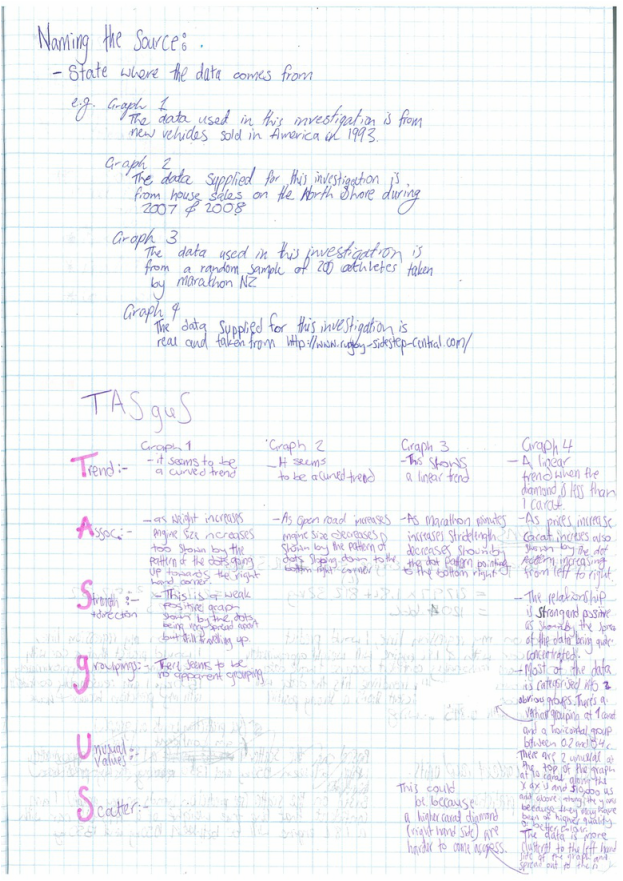
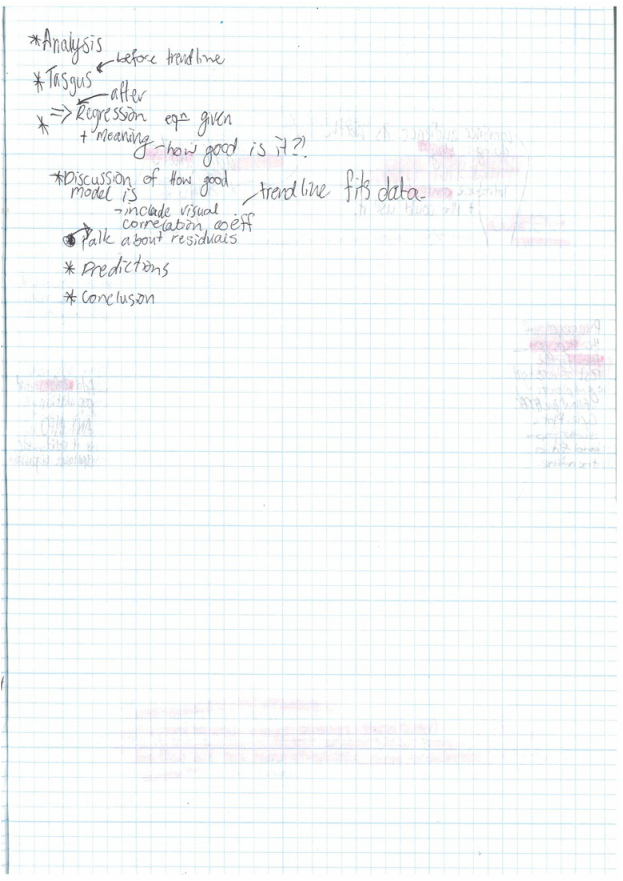
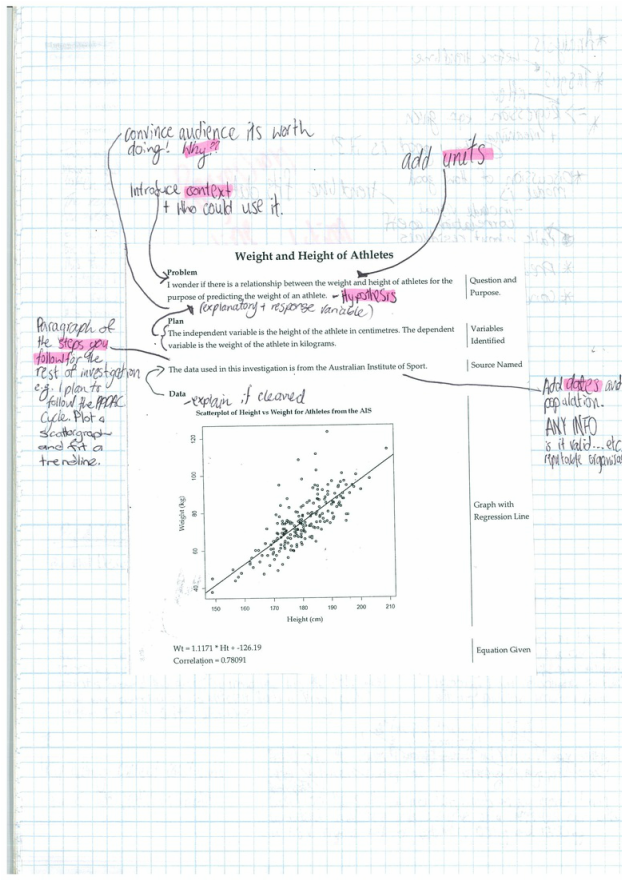
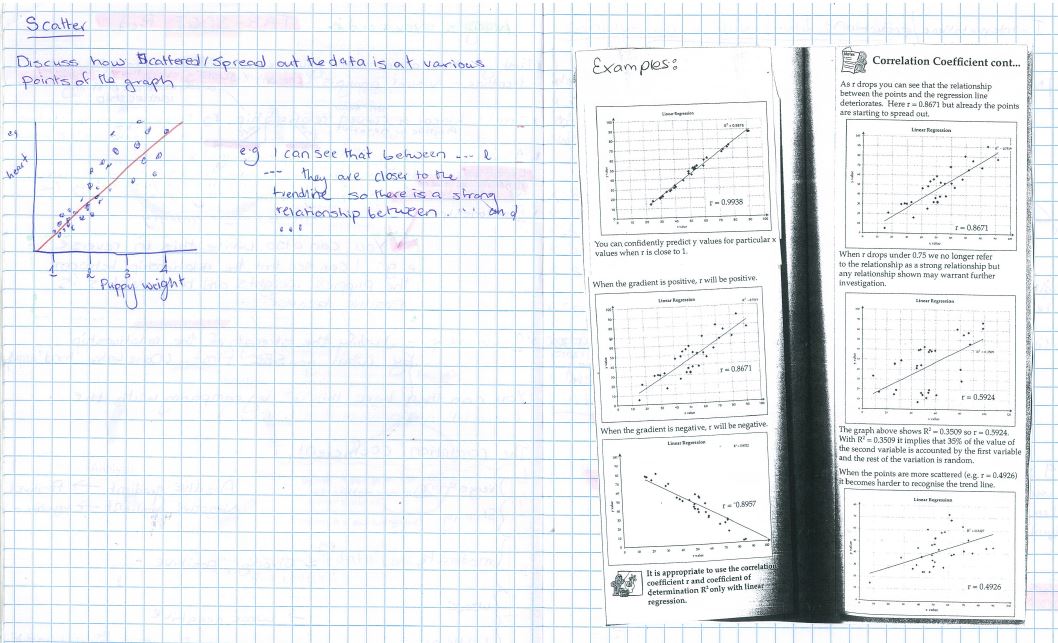
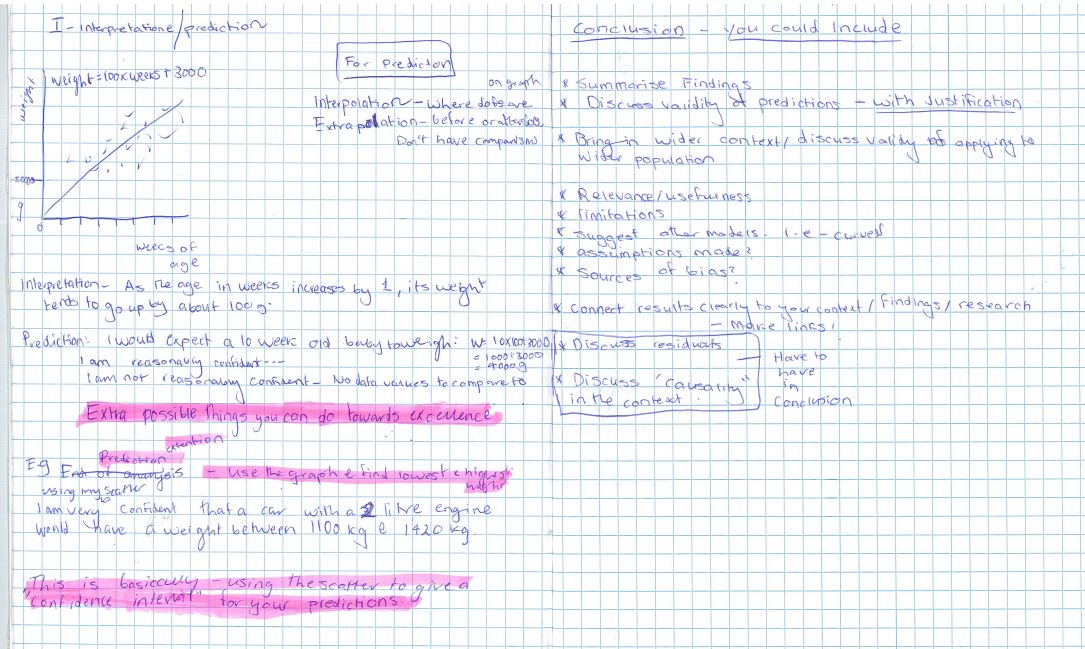
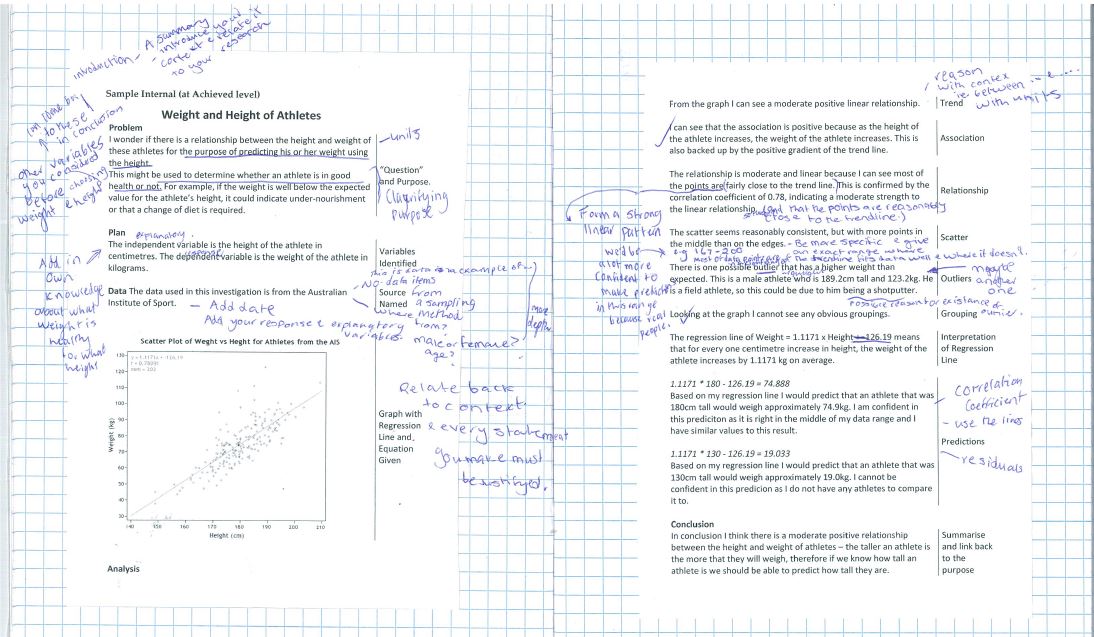
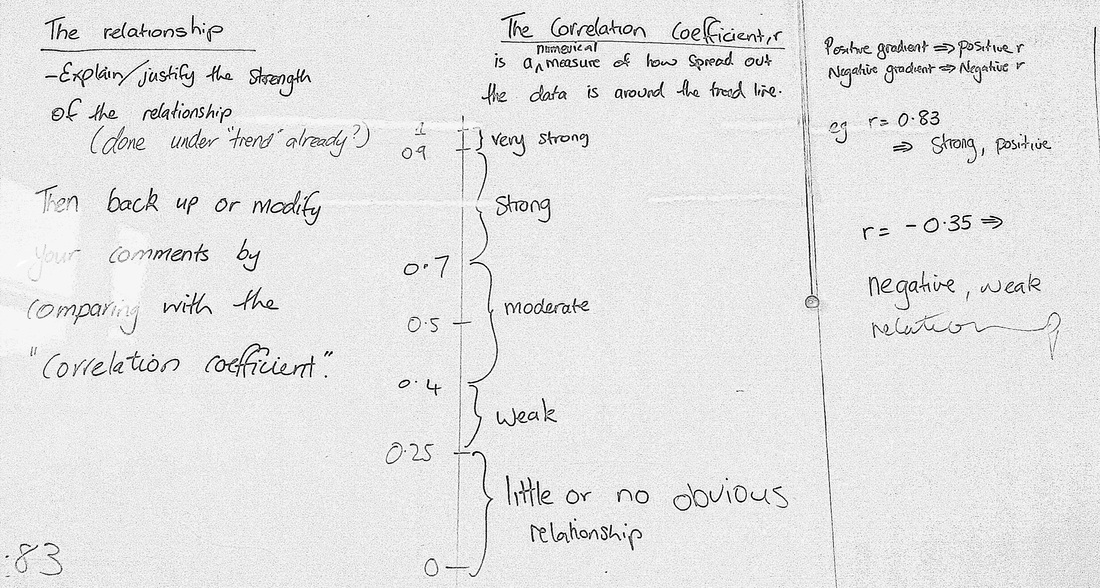
Below is a scan of all pages of Grace's notes for Bivariate Data